

Three Pis, One Network
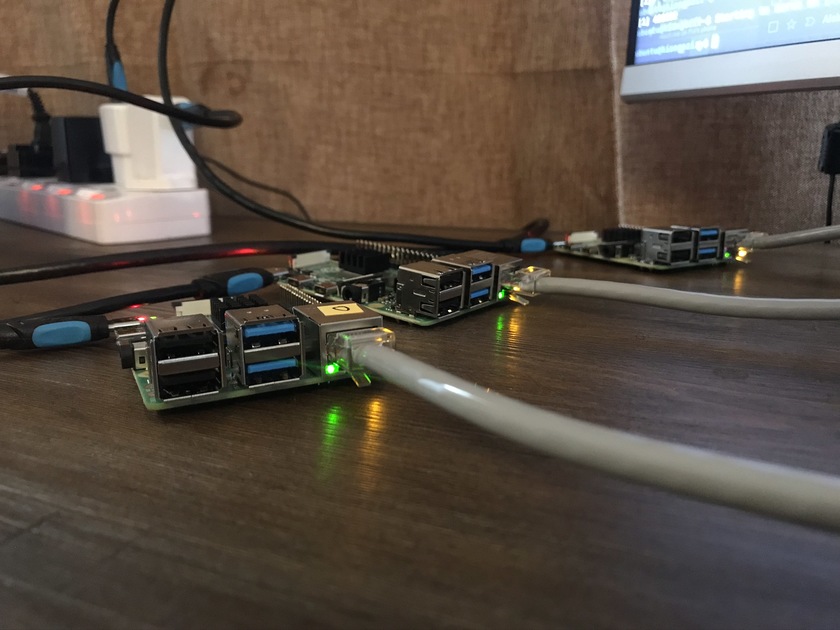
Setting up a subnet with three Pis and a switch

This is the second article in my home lab series. The first article in the series, Three Pis, One Network, describes in detail how to set up a private network with 3 (or more) Raspberry Pis.
I chose Kubernetes (a.k.a. k8s) because most of my home lab experiments are container based and require minimal resources. There are two Kubernetes distributions of note, microk8s and k3s. K3s has been around for longer, with a bigger support community. Microk8s is a relatively new Canonical project with excellent documentation.
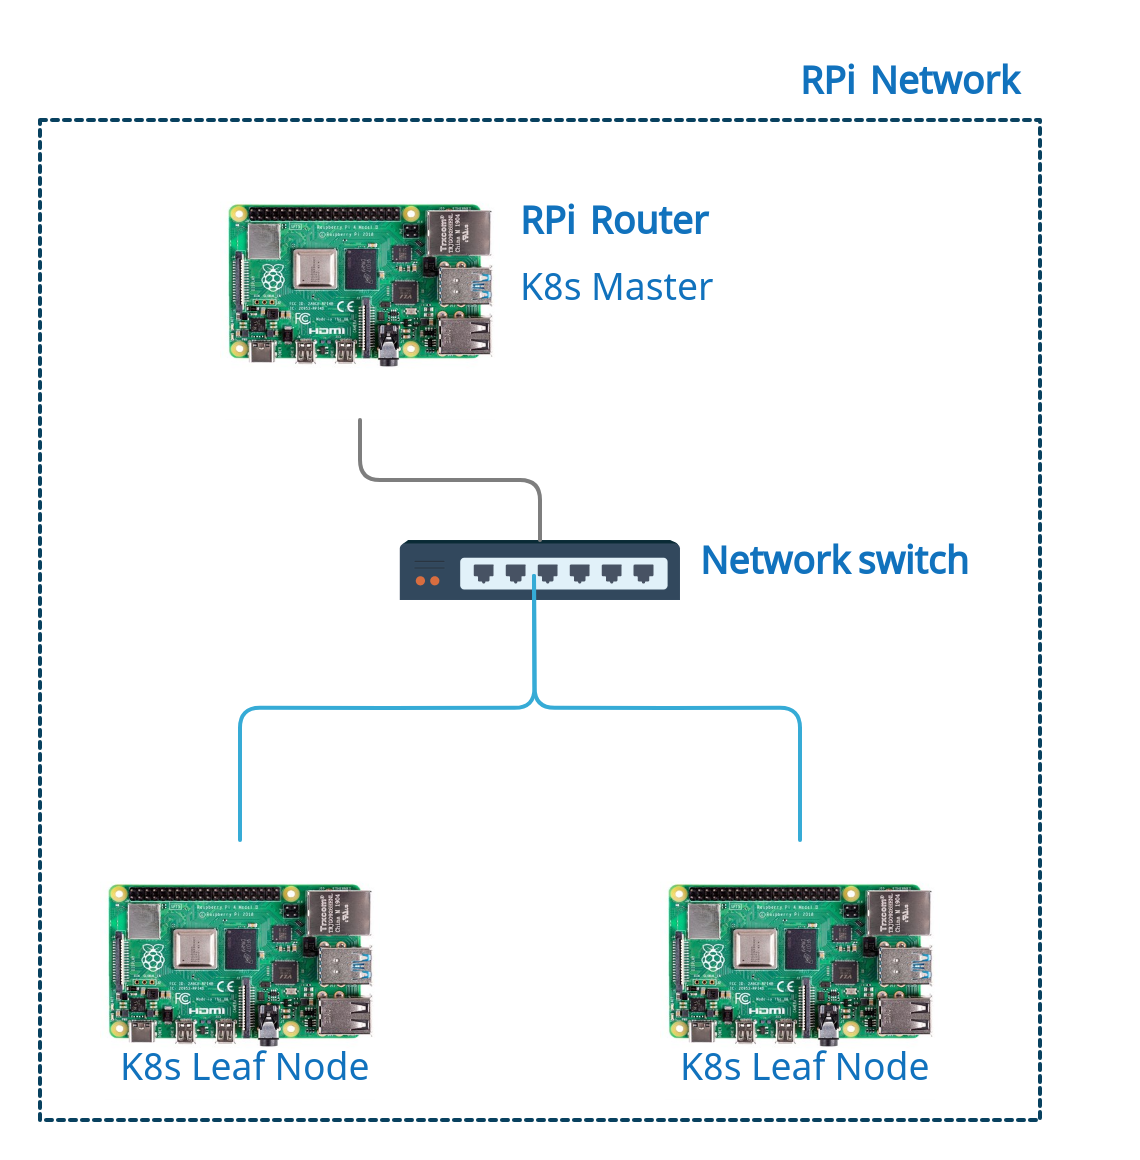
The diagram above describes role delegation for all the cluster nodes. The Router RPi will serve as the k8s master and the remaining two RPi hosts will serve as k8s leaf nodes. Microk8s is my Kubernetes distro of choice.
Kubernetes requires static IP addresses for each node in the cluster.
I edited /etc/dnsmasq.conf and added the following lines.
# /etc/dnsmasq.conf
# assign static IP addresses to each Pi
# these are dummy MAC addresses
dhcp-host=dc:a6:32:00:00:01,10.0.0.50
dhcp-host=dc:a6:32:00:00:02,10.0.0.51
The lines above bind each RPi’s MAC address to a static IP address.
Before installing MicroK8s I had to enable cgroups. I looked this up because my Linux kernel understanding is a bit rusty. Cgroups (Control Groups) are a kernel feature which allow processes to be organized into ordered groups whose resource usage can be monitored and managed. Kubernetes uses this feature to manage container resources in a pod.
As per the MicroK8s tutorial, I edited the file /boot/firmware/cmdline.txt and added the following options:
cgroup_enable=memory cgroup_memory=1After the edit, a reboot is required. I did this on all the Pis in my network.
Installing Microk8s is very straight forward. There’s a snap package available, all I needed to do was install it on each RPi in my network.
I executed the following commands on each RPi:
#install microk8s
sudo snap install microk8s --classic --channel=1.20/stable
# add the current user to the group 'microk8s'
sudo usermod -a -G microk8s $USER
# change ownership of the file ~/.kube to the current user
sudo chown -f -R $USER ~/.kube
# add an alias for the command 'microk8s kubectl'
tee -a ~/.bash_aliases <<<EOF
alias kubectl='microk8s kubectl'
EOF

source ~/.bash_aliases
I read through this command reference to familiarize myself with the microk8s command line interface.
At the time of writing, Microk8s v1.20 was the latest stable release available. Prior to its release I tried out v1.19 and encountered a major issue while adding multiple nodes to the cluster. I have not encountered this issue with v1.20.
Once microk8s is installed on all the Pis, I ran the following command on the Router RPi (designated master node):
sudo microk8s.add-nodeThe command above generates the following output:
From the node you wish to join to this cluster, run the following:
microk8s join 192.168.1.10:25000/182474c990a59770b1abe3ef9a5a40fd

If the node you are adding is not reachable through the default interface you can use one of the following:
 microk8s join 10.0.0.1:25000/182474c990a59770b1abe3ef9a5a40fd
 microk8s join 192.168.1.10:25000/182474c990a59770b1abe3ef9a5a40fd
 microk8s join 172.17.0.1:25000/182474c990a59770b1abe3ef9a5a40fd
 microk8s join 10.1.24.0:25000/182474c990a59770b1abe3ef9a5a40fd
I ssh'd into one of the RPi nodes and ran the command:
# I used the master IP 10.0.0.1 because that's the interface IP address that's reachable by the node
microk8s join 10.0.0.1:25000/182474c990a59770b1abe3ef9a5a40fd
I generated a new connection string and added the other RPi node to the cluster.
Back on the master node I ran the following command:
kubectl get nodeWhich returns:
NAME       STATUS   ROLES    AGE   VERSION
10.0.0.1   Ready    <none>   1d   v1.20.1-34+97978f80232b01
10.0.0.50  Ready    <none>   1d   v1.20.1-34+97978f80232b01
10.0.0.51  Ready    <none>   1d   v1.20.1-34+97978f80232b01
The cluster is on like the break of dawn.
Microk8s comes with a number of addons that you can use to enrich your Kubernetes cluster. The first addon I enabled was the Kubernetes dashboard. How else could I monitor my little pods?
I executed the following commands on my master node:
# enable the dashboard and a few other necessary addons
microk8s enable dns dashboard
# label the dashboard service
kubectl label service/kubernetes-dashboard kubernetes.io/cluster-service=true --namespace kube-system
# Proxy to make the dashboard accessible from my home network
sudo microk8s.kubectl proxy --accept-hosts=.* --address=0.0.0.0 &
Executing the command kubectl cluster-info now returns:
Kubernetes control plane is running at https://127.0.0.1:16443
CoreDNS is running at https://127.0.0.1:16443/api/v1/namespaces/kube-system/services/kube-dns:dns/proxy
Metrics-server is running at https://127.0.0.1:16443/api/v1/namespaces/kube-system/services/https:metrics-server:/proxy
kubernetes-dashboard is running at https://127.0.0.1:16443/api/v1/namespaces/kube-system/services/https:kubernetes-dashboard:/proxy
The Kubernetes dashboard has a secure token based login system. I’m not too concerned about security (the Kubernetes cluster is only accessible from my home network) so I disabled the login mechanism on the dashboard.
sudo microk8s.kubectl -n kube-system edit deploy kubernetes-dashboard -o yaml
# Add '- --enable-skip-login' after '- --namespace=kube-system'
The edit should end up like this:
spec:
      containers:
      - args:
        - --auto-generate-certificates
        - --namespace=kube-system
        - --enable-skip-login # the new line
The dashboard was now accessible on the master node’s home network IP address:
http://192.168.1.10:8001/api/v1/namespaces/kube-system/services/https:kubernetes-dashboard:/proxy/#/overview?namespace=defaultNote: the login page still shows up but there’s a skip button which allow you to bypass the login procedure.
Microk8s v1.20 ships with Prometheus.
microk8s enable prometheus
# port forwarding to enable external access to Prometheus dashboard
microk8s kubectl port-forward -n monitoring service/prometheus-k8s --address 0.0.0.0 9090:9090
# port forwarding to enable external access to Grafana dashboard
microk8s kubectl port-forward -n monitoring service/grafana --address 0.0.0.0 3000:3000
I could now access the Prometheus dashboard on..
http://192.168.1.10:9090/..and the Grafana dashboard on
http://192.168.1.10:3000/ The Grafana dashboard has a default username:password => admin:admin.
Besides the node connection issue I encountered with microk8s v1.19, I did not encounter any other blockers while creating my k8s cluster.
The next article in this series will be about one of my favorite experiments!
Setting up a subnet with three Pis and a switch